In this article, you’ll learn how to use the ChartJS library with Angular.
I’ve been working on an AngularJS to Angular migration recently at work and we have a component with the app which renders a chart of data using ChartJS.
The app is making use of a plugin library that handles all the interaction between AngularJS and ChartJS so I needed to find something that would replace this.
Using ngx-chartjs
Luckily, there is such a package to do this.
It’s called ngx-chartjs and it provides convienient Angular bindings that allow you to provide chart data as an input.
Let’s get setup with a simple chart component.
Installing ngx-chartjs
Simply install the package and the ChartJS library.
npm install @ctrl/ngx-chartjs chart.jsAnd while we’re at it let’s create a component to display our chart.
ng generate component simpleChartWe’ll also need to add the ngx-chartjs module to our Angular application. Let’s add it directly to app.module.ts.
import { ChartjsModule } from '@ctrl/ngx-chartjs';
...
imports: [
    BrowserModule,
    AppRoutingModule,
    ChartjsModule,
  ],
...
Setting up our component
Let’s create some data to display in our chart, notice the new property data on component.
import { Component, OnInit } from '@angular/core';

@Component({
  selector: 'app-simple-chart',
  templateUrl: './simple-chart.component.html',
  styleUrls: ['./simple-chart.component.scss']
})
export class SimpleChartComponent implements OnInit {
  public data = {
    labels: ['January', 'February', 'March', 'April', 'May', 'June', 'July'],
    datasets: [
      {
        label: 'My First Dataset',
        data: [65, 59, 80, 81, 56, 55, 40],
      }
    ]
  }

  constructor() { }

  ngOnInit() {}
}
Then inside the template for the component, let’s add an ngx-chartjs component.
<ngx-chartjs [data]="data" type="bar"></ngx-chartjs>Rendering our Chart
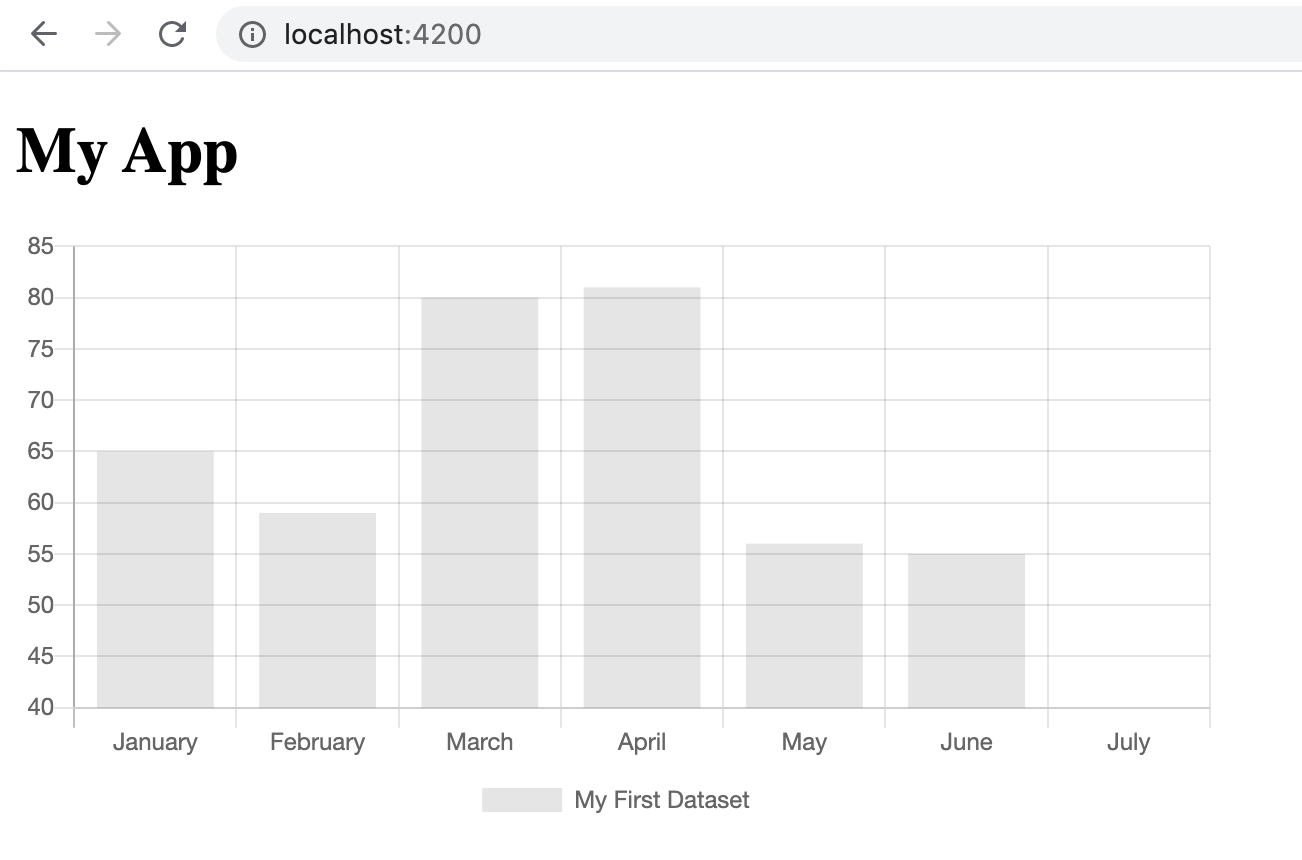
With our simple chart component created, you can drop it anywhere in your project to see it.
For example, in our app.component.html.
<h1>My App</h1>

<div style="width: 600px;">
  <app-simple-chart></app-simple-chart>
</div>
Notice how i’ve added a container div element with a fixed width around the chart component.
By default the ngx-chartjs component takes up 100% width so you will probably want to contain it at some point in your document (although using a CSS class with a layout would be a better option, the inline style is just for demonstration).
Benefits of ngx-chartjs (Data Binding)
So you might be thinking, ‘Why not just import the ChartJS library manually and drop a chart in an Angular component template?’
Well you could easily do that but ngx-chartjs gives us a pre-built component with Angular features such as data binding i.e. we can update the data we provide to ChartJS dynamically and the chart will update.
All you need to do is re-assign a new value (replace the entire objec) to the data property.
